

17.1 The precision, bias and lower limit of detection of Method A have been evaluated by a statistical examination of the results of an inter-laboratory test of mineral oil test specimens.12 A lower limit of repetition is defined here as an aid in the testing of transformers in factories.
17.2 Precision – Repeatability - The expected difference between successive results obtained on identical test specimens by the same operator using the same apparatus and normal and correct operation of the test method.
17.2.1 Combustible Gases and Carbon Dioxide - Repeatability of the determination of each individual combustible gas and of carbon dioxide was found to vary linearly with individual gas concentration level. The repeatability interval at the 95 % confidence level for the determination of a combustible gas n or of CO2, ln(r) 95 % can be represented by:
where ln(r) 95 % is the value of the repeatability coefficient for the determination of that combustible gas or of carbon dioxide. Cn is the concentration level of the gas of interest (ppm). The repeatability coefficients at the 95 % level for each of the combustible gases and for CO2 and the concentration ranges tested are given in Table 1.
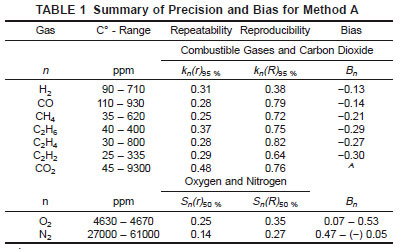
17.2.2 Oxygen and Nitrogen - The ranges of concentrations of oxygen and nitrogen in the test specimens analyzed in the inter-laboratory test were relatively narrow. Therefore the relationships between repeatability intervals and concentrations of dissolved O2 or of N2 are not well defined. The coefficients of variation, S(r), at the 50 % confidence level for the repeatability of the determination of O2 and of N2 and the concentration ranges tested are given in Table 1.
17.3 Precision–Reproducibility - The expected difference between two results obtained on identical test specimens by different operators working in different laboratories under normal and correct operation of the test method.
17.3.1 Combustible Gases and Carbon Dioxide - Reproducibility of the determination of each individual combustible gas and of carbon dioxide was found to vary linearly with individual gas concentration level. The reproducibility
interval at the 95 % confidence level for the determination of acombustible gas n or of CO2, ln(R)95 % can be represented by:
where ln(R)95 % is the value of the reproducibility coefficient for the determination of that combustible gas or of carbon dioxide. Cn is the concentration level of the gas of interest (ppm). The reproducibility coefficients at the 95 % level for each of the combustible gases and CO2 and the concentration ranges tested are given in Table 1.
17.3.2 Oxygen and Nitrogen - The ranges of concentrations of oxygen and of nitrogen contained were relatively narrow in the specimens analyzed in the interlaboratory test. Therefore the relationships between reproducibility intervals and concentration of dissolved O2 or N2 are not well defined. The coefficients of variation, S(R), at the 50 % confidence level for the reproducibility of the determination of O2 and of N2 and the concentration ranges tested are given in Table 1.
17.4 Bias - The difference between the mean of results obtained for a gas in a test specimen and the "true" (that is, spiked) value of the concentration of that gas in the tested material.
17.4.1 Combustible Gases - Bias of the determination of each individual combustible gas was found to vary linearly with individual gas concentration level. The relative bias, Bn, for the determination of a combustible gas, n, can be represented by:
where Cn is the concentration level of the gas of interest (ppm) and Cno is the "true" (spiked) value of the concentration of that gas in that test material. The bias and the concentration ranges tested are given in Table 1 for each of the combustible gases. The biases in results from Method A for the combustible gases are uniformly negative.
17.4.2 Carbon Dioxide - Bias for the determination of carbon dioxide decrease with increasing CO2. No analytical transformation adequately fits the results; these results are shown graphically in Fig. 5. It is possible that the positive bias at lower concentrations results, in part, from contamination by air.
17.4.3 Oxygen and Nitrogen - The bias for determinations of O2 and of N2 are positive and variable. It is possible that positive bias is, in part, the result of contamination by air. Also, the ranges of concentrations of oxygen and of nitrogen in the test specimens analyzed in the interlaboratory test were relatively narrow. The relationships between bias and dissolved concentration of O2 or of N2 then are not well defined. The coefficients of variation S(R) at the 50 % confidence level for the reproducibility of the determination of O2 and of N2 and the concentration ranges tested are given in Table 1.