

ASTM D3710 Standard Test Method for Boiling Range Distribution of Gasoline and Gasoline Fractions by Gas Chromatography
11. Calculation
11.1 Drift Correction - Drift correction is not necessary if the drift is less than 0.5 % as calculated in 8.3.
11.1.1 Correct the blank, calibration, and sample runs for initial offset from zero by subtracting from each time interval the average area of the first five time intervals in the corresponding run. Omit from the average any readings (extraneous peaks) that are more than three times the noise as defined in 8.2.
11.1.2 Correct the calibration and sample for drift by subtracting the corrected area of each time segment of the blank from the corresponding segment of the sample.
NOTE 18 - The corrected area for each time segment is calculated as follows:
ACi = Ai - AB/i - (O - OB)
where:
ACi = corrected area of segment i, sample or calibration,
Ai = uncorrected area of segment i,
ABi = area of corresponding segment of blank,
O = offset from run, sample or calibration, and
OB = offset from blank.
11.1.3 An alternative procedure of correcting for drift and offset is by subtracting a triangular segment of area based on the sample itself as illustrated in Fig. 5.
NOTE 19 - For the scheme shown in Fig. 5, the corrected area for each
time segment is calculated as follows:
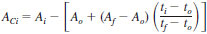
where:
ACi = corrected area of segment i, sample or calibration,
Ai = uncorrected area of segment i,
Ao = average area of last five segments before start of first peak,
Af = area of first segment after end of last peak,
ti = time to segment i from beginning of run,
to = time to last segment before start of first peak, and
tf = time to first segment after end of last peak.
11.1.4 In cases where the calibration is peak-integrated instead of time-sliced, the drift corrections need not be applied.
11.2 Response Factors:
11.2.1 Using the corrected areas from the calibration run and composition of the calibration mixture, calculate the response factor relative to the factor for nC7 for all compounds iC5 and heavier:
Response factor, Fi = (Vi x Ac)/(Vo x Aci)
where:
Fi = response factor of the compound,
Aci = corrected area for each pure compound,
Vi = volume percent from the calibration mixture,
ACo = corrected area of nC7, and
Vo = volume percent of nC7 in the calibration mixture.
11.2.2 Determine the response factors for propane, isobutane, and n-butane in the following manner. Calculate the relative molar response, RMR, for each of the normal paraffins starting with nC5 as follows:
RMRi = (Aci x mo)/(Aco x mi)
where:
RMRi = relative molar response for the compound,
mi = mole percent of the compound in the calibration mixture, and
mo = mole percent of nC7 in the calibration mixture.
The RMR is a linear function of molecular weight. The measured RMR's are fit to the linear equation RMR = a MW + b employing the least squares technique. The RMR for propane and n-butane is calculated using the resulting equation. For isobutane, use the RMR measured for n-butane. Calculate response factors for these three components as follows:
Response factor, Fi = (MWi x RMRo x Deno)/(MWo x RMRi x Deni)
where:
MWi = molecular weight of the compound,
MWo = molecular weight of nC7,
RMRi = relative molar response of the compound,
RMRo = relative molar response of nC7,
Deni = relative density of the compound, and
Deno = relative density of nC7.
Typical response factors along with relative densities are shown in Table 2.
NOTE 20 - If the concentrations of propane and butane in the calibration mixture are known, differences noted between the observed and calculated response factors indicate loss of front-end components. If a fresh calibration mixture is used, these differences can be indicative of sampling problems. Deviation of the response factors of the heavier components from the straight-line relationship could indicate problems in volatilizing the sample. Possible reasons include injection port temperature being too low, insufficient carrier gas flow, or lack of homogeneity in sampling. Fig. 6 illustrates these effects.
11.2.3 Apply the response factor for each compound in the calibration mixture to the corrected areas of all time intervals in the sample that falls between a point (a) that is halfway between the observed apex of that compound and the observed apex of that compound and the observed apex of the preceding compound, and a point (b) that is halfway between the observed apex of that compound and the observed apex of the succeeding compound. The response factors used may differ according to sample type. For commercial gasolines, typical response factors are shown in Table 2. For gasoline blending components containing small amounts of aromatics, such as alkylates, the aromatic response factors should be omitted and only paraffin response factors used. The response factors measured are used until such time as the detectors or columns are changed or there is some reason to suspect that their values are no longer applicable.
11.3 Calculation of Sample:
11.3.1 For each time segment between the beginning of the first peak and the end of the last peak, multiply the area by the suitable response factor to get volume counts. Divide the cumulative volume counts at the end of each interval by the total volume counts and multiply by 100. This will give the cumulative percent of sample recovered at each interval.
11.3.2 Tabulate the cumulative volume percent recovered at each interval and the retention time at the end of the interval. Using linear interpolation where necessary, determine the retention time associated with 0.5 and 99.5 volume % recovered. These are respectively the initial and final boiling points. Determine the retention time for each volume percent off between 1 and 99.
11.3.3 For each volume percent and its associated retention time, determine the corresponding temperature from the calibration curve (10.2.2). Use linear interpolation between all calibration points.
11.3.4 Identify individually the propane through isopentane peaks by comparing the retention time of each peak to the corresponding retention time in the calibration run. Check to see that the retention time of the apex of the propane, iso-, and normal butane and isopentane peaks is within a time equivalent to 5°F (3°C) of the calibration run. Note any isopentane or lighter component that is apparently absent. Calculate the volume percent of the individual compounds by using the suitable response factors. Include any peaks between normal butane and isopentane with the normal butane peak.