

ASTM D6299 Standard Practice for Applying Statistical Quality Assurance Techniques to Evaluate Analytical Measurement System Performance
9. Evaluation of System Performance in Terms of Precision and Bias
9.1 Site Precision Estimated from Testing of QC Samples:
9.1.1 Estimate the site precision of the measurement system at the level corresponding to a specific lot of QC sample as 2.46 times the MR from the MR chart for that specific lot.
R' = 2.46 x MR
NOTE 22 - The site precision standard deviation (sR') is estimated from the MR chart as R'/2.77 = MR/1.128.
9.1.1.1 Alternatively, R' many be estimated using the root-mean-square formula for standard deviation:
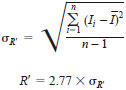
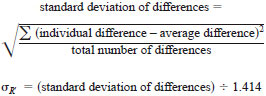
9.1.1.2 For estimate of site precision standard deviation (sR') using retain results, first obtain the standard deviation of differences by applying the root-mean-square formula below to the differences between the original and retest results for samples with same nominal property level. If measurement process precision is known to be level independent, retest results from samples with different property levels can be used. Divide the standard deviation of differences by 1.414 to obtain the estimate for site precision standard deviation. (sR').
9.1.2 Compare R' to published reproducibility of the test method at the same level, if available. R' is expected to be less than or equal to the published value. Use the x2 test described in A1.7.
9.2 Measurement System Bias Estimated from Multiple Measurements of a Single Check Standard - If a minimum of 15 test results is obtained on a single check standard material under site precision conditions, then calculate the average of all the in-control individual differences plotted on the I chart. Perform a t test (see A1.6) to determine if the average is statistically different from zero.
9.2.1 If the outcome of the ttest is that the average is not statistically different from zero, then the bias in the measurement process is negligible.
9.2.2 If the outcome of the t test is that the average is statistically different from zero, then the best estimate of the measurement process bias at the level of the check standard is the average.
9.3 Measurement System Bias Estimated from Measurements of Multiple Check Standards - When using multiple check standards, determine if there is a relationship between the bias and the measurement level.
9.3.1 Plot the pretreated results as per Section 8 versus their corresponding ARVs. Examine the plot for patterns indicative of level-dependent bias.
9.3.2 If there is no discernible pattern, perform the t test as described in 9.2 to determine if the average of all the pretreated differences plotted on the I chart is statistically different from zero.
9.3.2.1 If the outcome of the t test is that the average is not statistically different from zero, then the bias in the measurement process is negligible.
9.3.2.2 If the outcome of the t test is that the average is statistically different from zero, then there is evidence that the measurement system is biased. The bias may be level dependent. However, the statistical methodology for estimating the bias/level relationship is beyond the scope of this practice.
9.3.3 If there is a discernible pattern in the plot in 9.3.1, then the measurement system may exhibit a level dependent bias. The statistical methodology for estimating the bias/level relationship is beyond the scope of this practice.
9.3.4 If a bias is detected in 9.3.2.2, or if the plot in 9.3.3 exhibits discernible patterns, investigate for root cause(s).