

17. Calculation or Interpretation of Results for Test Method A and Test Method B
17.1 Calculation of the KHP concentration and NaOH molarity (mol/L).
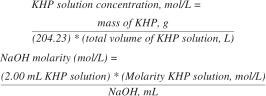
17.1.1 Calculation by Volume:
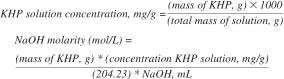
17.1.2 Calculation by Mass:
17.1.3 Calculation of Acidity:
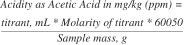
where:
Acetic Acid = the acidity of the sample as mg/kg (µg/g) acetic acid,
Molarity of Titrant = NaOH molarity (mol/L) titrant (approximately 0.01 mol/L (M),
Titrant, mL = volume (mL) of titrant used to reach the end point,
Sample Mass = Sample size, g, and
60050 = 60.05 g/mol acetic acid * 1000 mg/g.
18. Report
18.1 Report the acidity as acetic acid to the nearest 0.1 mg/kg for the sample, and reference this test method.
19. Quality Control
19.1 Confirm the performance of the test procedure by analyzing a quality control (QC) sample that is representative of the samples typically analyzed, if possible.
19.1.1 The KHP solution or other suitable material may be used as a check sample. No data is available for the shelf life of the KHP solution.
19.2 Prior to monitoring the measurement process, the user of the method needs to determine the average value and control limits of the QC sample.
19.3 Record the QC results and analyze by control charts or other statistically equivalent technique to ascertain the statistical control status of the testing process. Any out-of-control data should trigger investigation for root cause(s). The results of this investigation may, but not necessarily, result in instrument recalibration or standardization.
19.4 The frequency of QC testing is dependent on the criticality of the quality being measured, the demonstrated stability of the testing process, and customer requirements. Generally, a QC sample should be analyzed each testing day. The QC frequency should be increased if a large number of samples are routinely analyzed. However, when it is demonstrated that the testing is under statistical control, the QC testing frequency may be reduced. The QC precision should be periodically checked against the precision listed in Precision and Bias, Section 20, of this test method to ensure data quality.
19.5 It is recommended that, if possible, the type of QC sample that is regularly tested be representative of the samples routinely analyzed. An ample supply of QC sample material should be available for the intended period of use, and must be homogeneous and stable under the anticipated storage conditions. Because the acidity can vary while the QC sample is in storage, when an out-of-control situation arises, the stability of the QC sample can be a source of the error.
20. Precision and Bias
20.1 The initial precision of this test method is based on a blind repeatability study conducted in 2011. Three laboratories performed Method A by potentiometric titration and three laboratories performed Method B by visual color end point titration. Each laboratory tested 18 samples that were labeled with an alphanumeric system which gave no indication of the expected acidity value or sample blend content. Within the 18 samples were exact duplicates of nine different samples types. The analyst had no knowledge of when they were running a duplicate. Every "test result" represents an individual determination. The laboratory was asked to submit a blind duplicate test results, from a single operator, for each material. Practice D6300 was followed for the design and analysis of the data; the details are given in ASTM Research Report RR:D02-1754.
20.1.1 Repeatability Limit (r) - Two test results obtained within one laboratory shall be judged not equivalent if they differ by more than the "r" value for that material; "r" is the interval representing the critical difference between two test results for the same material, obtained by the same operator, using the same equipment on the same day in the same laboratory.
20.1.1.1 Repeatability limits are listed in Table 1.
20.2 Bias - As no standard reference materials were distributed for analysis as part of this limited study, no statement of bias can be made at this time.
20.3 The precision statement was determined through statistical examination of nine materials with blind duplicates from three laboratories. The materials consisted of three blends of gasoline with ethanol, E30, E60, and denatured ethanol. These blends were measured pure, and with an addition of a known acetic acid spike of 100 ppm and 200 ppm.
20.4 Levels of acidity tested ranged from 8.5 to 268 mg/kg for potentiometric titration and 10.5 to 265 mg/kg for manual titration.
21. Keywords
21.1 acidity; denatured fuel ethanol; E30, E60 acetic acid; E95; ethanol; ethanol blends; potentiometric; titration