

ASTM D86 for distillation of petroleum products at atmospheric pressure
11. Calculations
11.1 The percent total recovery is the sum of the percent recovery (see 10.18) and the percent residue (see 10.19). Deduct the percent total recovery from 100 to obtain the percent loss.
11.2 Do not correct the barometric pressure for meniscus depression, and do not adjust the pressure to what it would be at sea level.
NOTE 21 - The observed barometric reading does not have to be corrected to a standard temperature and to standard gravity. Even without performing these corrections, the corrected temperature readings for the same sample between laboratories at two different locations in the world will, in general, differ less than 0.1°C at 100°C. Almost all data obtained earlier have been reported at barometric pressures that have not been corrected to standard temperature and to standard gravity.
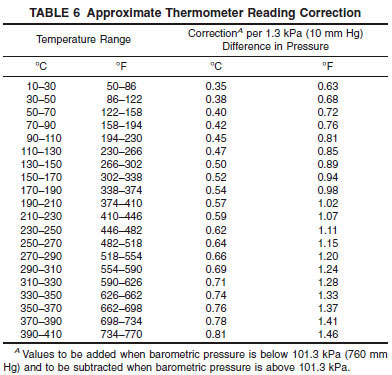
11.3 Correct temperature readings to 101.3 kPa (760 mm Hg) pressure. Obtain the correction to be applied to each temperature reading by means of the Sydney Young equation as given in Eq 3, Eq 4, or Eq 5, as appropriate, or by the use of Table 6. For Celsius temperatures:
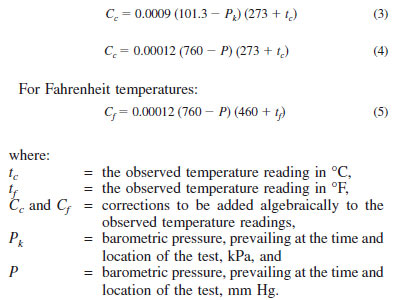
NOTE 22 - Temperature readings are not corrected to 101.3 kPa (760 mm Hg) when product definitions, specifications, or agreements between the parties involved indicate, specifically, that such correction is not required or that correction shall be made to some other base pressure.
11.4 Correct the actual loss to 101.3 kPa (760 mm Hg) pressure when temperature readings are corrected to 101.3 kPa pressure. The corrected loss, Lc, is calculated from Eq 6 or Eq 7, as appropriate, or can be read from the tables presented as Fig. X3.1 or Fig. X3.2.
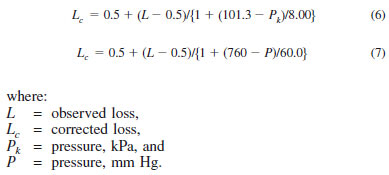
NOTE 23 - Eq 6 and 7 above have been derived from the data in Table A4.1 and Eqs 5 and 6 in Test Method D 86 – 95 and earlier versions. It is probable that Eq 6 and 7 shown were the original empirical equations from which the table and equations in the Test Method D 86 – 95 and earlier versions were derived.
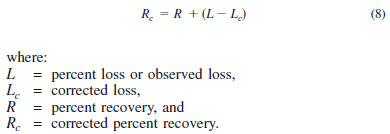
11.4.1 Calculate the corresponding corrected percent recovery in accordance with the following equation:
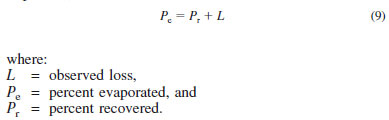
11.5 To obtain the percent evaporated at a prescribed temperature reading, add the percent loss to each of the observed percent recovered at the prescribed temperature readings, and report these results as the respective percent evaporated, that is:
11.6 To obtain temperature readings at prescribed percent evaporated, and if no recorded temperature data is available within 0.1 volume % of the prescribed percent evaporated, use either of the two following procedures, and indicate on the report whether the arithmetical procedure or the graphical procedure has been used.
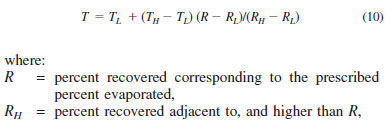
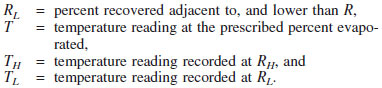
11.6.1 Arithmetical Procedure - Deduct the observed loss from each prescribed percent evaporated to obtain the corresponding percent recovered. Calculate each required temperature reading as follows:
11.6.2 Graphical Procedure - Using graph paper with uniform subdivisions, plot each temperature reading corrected for barometric pressure, if required (see 11.3), against its corresponding percent recovered. Plot the IBP at 0 % recovered. Draw a smooth curve connecting the points. For each prescribed percent evaporated, deduct the distillation loss to obtain the corresponding percent recovered and take from the graph the temperature reading that this percent recovered indicates. Values obtained by graphical interpolation procedures are affected by the care with which the plot is made.
NOTE 24 - See Appendix X1 for numerical examples illustrating the arithmetical procedure.
11.6.3 In most automated instruments, temperature-volume data are collected at 0.1 volume % intervals or less and stored in memory. To report a temperature reading at a prescribed percent evaporated, neither of the procedures described in 11.6.1 and 11.6.2 have to be used. Obtain the desired temperature directly from the database as the temperature closest to and within 0.1 volume % of the prescribed percent evaporated.