

IEC 60599 Mineral oil-impregnated electrical equipment in service - Guide to the interpretation of dissolved and free gases analysis
5 Identification of faults
Any gas formation in service, be it minimal, results from a stress of some kind, even if it is a very mild one, like normal temperature ageing. However, as long as gas formation is below typical values, it should not be considered as an indication of a "fault", but rather as "typical gas formation" (see figure 1).
5.1 Dissolved gas compositions
Although the formation of some gases is favoured, depending on the temperature reached or the energy contained in a fault (see 4.1), in practice mixtures of gases are almost always obtained. One reason is thermodynamic: although not favoured, secondary gases are still formed, albeit in minor quantities. Existing thermodynamic models derived from the petroleum industry, however, cannot predict accurately the gas compositions formed, because they correspond to ideal gas/temperature equilibria which do not exist in actual faults. Large temperature gradients also occur in practice, for instance as a result of oil flow or vaporization along a hot surface. This is particularly true in the case of arcs with power follow-through, which transfer a lot of heat to the oil vapour/decomposition gas layer between the arc and the oil, probably explaining the increasing formation of ethylene observed in addition to acetylene. In addition, existing thermodynamic models do not apply to paper, which turns irreversibly to carbon above 300 °C.
5.2 Types of faults
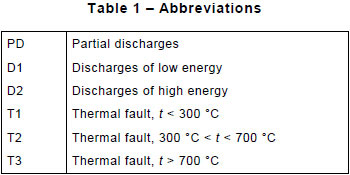
Internal inspection of hundreds of faulty equipment has led to the following broad classes of visually detectable faults:
- partial discharges (PD) of the cold plasma (corona) type, resulting in possible X-wax deposition on paper insulation, or of the sparking type, inducing pinhole, carbonized perforations (punctures) in paper, which, however, may not be easy to find;
- discharges of low energy (D1), in oil or/and paper, evidenced by larger carbonized perforations through paper (punctures), carbonization of the paper surface (tracking) or carbon particles in oil (as in tap changer diverter operation);
- discharges of high energy (D2), in oil or/and paper, with power follow-through, evidenced by extensive destruction and carbonization of paper, metal fusion at the discharge extremities, extensive carbonization in oil and, in some cases, tripping of the equipment, confirming the large current follow-through;
- thermal faults, in oil or/and paper, below 300 °C if the paper has turned brownish (T1), and above 300 °C if it has carbonized (T2);
- thermal faults of temperatures above 700 °C (T3) if there is strong evidence of carbonization of the oil, metal coloration (800 °C or metal fusion (>1 000 °C).
5.3 Basic gas ratios
Each of the six broad classes of faults leads to a characteristic pattern of hydrocarbon gas composition, which can be translated into a DGA interpretation table, such as the one recommended in table 2 and based on the use of three basic gas ratios:
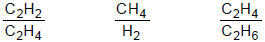
Table 2 applies to all types of equipment, with a few differences in gas ratio limits depending on the specific type of equipment.
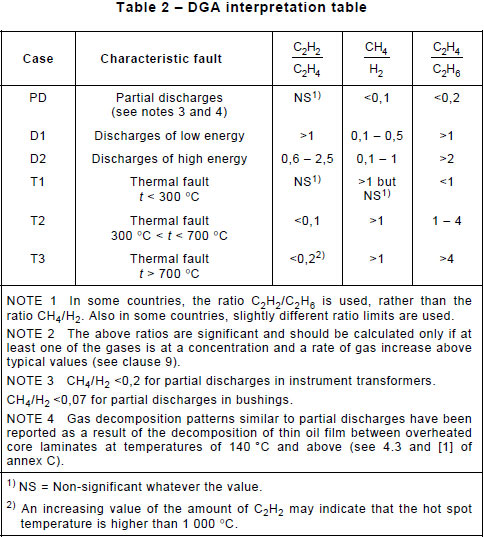
Typical examples of faults in the various types of equipment (power transformers, instrument transformers, etc.), corresponding to the six cases of table 2, may be found in tables A.1, A.5, A.7 and A.11.
Some overlap between faults D1 and D2 is apparent in table 2, meaning that a dual attribution of D1 or D2 must be given in some cases of DGA results. The distinction between D1 and D2 has been kept, however, as the amount of energy in the discharge may significantly increase the potential damage to the equipment and necessitate different preventive measures.
NOTE Combinations of gas ratios which fall outside the range limits of table 2 and do not correspond to a characteristic fault of this table may be considered a mixture of faults, or new faults which combine with a high background gas level (see 6.1).
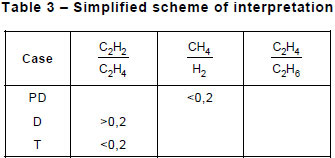
In such a case, table 2 cannot provide a diagnosis, but the graphical representations given in annex B may be used to visualize which characteristic fault of table 2 is closest to the case.
The less detailed scheme of table 3 may also be used in such a case in order to get at least a rough distinction between partial discharges (PD), discharges (D) and thermal fault (T), rather than no diagnosis at all.
5.4 CO2/CO ratio
The formation of CO2 and CO from oil-impregnated paper insulation increases rapidly with temperature. Incremental (corrected) CO2/CO ratios less than 3 are generally considered as an indication of probable paper involvement in a fault, with some degree of carbonization.
In order to get reliable CO2/CO ratios in the equipment, CO2 and CO values should be corrected (incremented) first for possible CO2 absorption from atmospheric air, and for the CO2 and CO background values (see 6.1 and clause 9), resulting from the ageing of cellulosic insulation, overheating of wooden blocks and the long term oxidation of oil (which will be strongly influenced by the availability of oxygen caused by specific equipment construction details and its way of operation).
Air-breathing equipment, for example, saturated with approximately 10 % of dissolved air, may contain up to 300 µl/l of CO2 coming from the air. In sealed equipment, air is normally excluded but may enter through leaks, and CO2 concentration will be in proportion of air present.
When excessive paper degradation is suspected (CO2/CO < 3), it is advisable to ask for a furanic compounds analysis or a measurement of the degree of polymerization of paper samples, when this is possible.
5.5 O2/N2 ratio
Dissolved O2 and N2 may be found in oil, as a result of contact with atmospheric air in the conservator of air-breathing equipment, or through leaks in sealed equipment. At equilibrium, taking into account the relative solubilities of O2 and N2, the O2/N2 ratio in oil reflects air composition and is close to 0,5.
In service, this ratio may decrease as a result of oil oxidation and/or paper ageing, if O2 is consumed more rapidly than it is replaced by diffusion. Factors such as the load and preservation syst.em used may also affect the ratio, but ratios less than 0,3 are generally considered to indicate excessive consumption of oxygen.
5.6 C2H2/H2 ratio
In power transformers, on load tap changer (OLTC) operations produce gases corresponding to discharges of low energy (D1). If some oil or gas communication is possible between the OLTC compartment and the main tank, or between the respective conservators, these gases may contaminate the oil in the main tank and lead to wrong diagnoses. The pattern of gas decomposition in the OLTC, however, is quite specific and different from that of regular D1s in the main tank.
C2H2/H2 ratios higher than 2 to 3 in the main tank are thus considered as an indication of OLTC contamination. This can be confirmed by comparing DGA results in the main tank, in the OLTC and in the conservators. The values of the gas ratio and of the acetylene concentration depend on the number of OLTC operations and on the way the contamination has occurred (through the oil or the gas).
NOTE If contamination by gases coming from the OLTC is suspected, interpretation of DGA results in the main tank should be done with caution by substracting background contamination from the OLTC, or should be avoided as unreliable.
5.7 C3 hydrocarbons
The interpretation method of gas analysis indicated above takes into account only C1 and C2 hydrocarbons. Some practical interpretation methods also use the concentrations of C3 hydrocarbons, and their authors believe that they are liable to bring complementary information which is useful to make the diagnosis more precise. Because the C3 hydrocarbons are very soluble in oil, their concentrations are practically not affected by a possible diffusion into ambient air. Conversely, and because they are very soluble, they are difficult to extract from the oil and the result of the analysis may greatly depend on the extraction method used. Moreover, experience has shown that, in most cases, a satisfactory diagnosis can be made without taking into account these hydrocarbons and for the sake of simplification, they have been omitted from the interpretation method indicated above.
5.8 Evolution of faults
Faults often start as incipient faults of low energy, which may develop into more serious ones of higher energies, leading to possible gas alarms, breakdowns and failures.
When a fault is detected at an early stage of development, it may be quite informative to examine not only the increase in gas concentrations, but also the possible evolution with time toward a more dangerous high-energy fault of the final stage type.
For example, some current transformers have operated satisfactorily for long periods of time with very high levels of hydrogen produced by partial discharges. However, partial discharges may also cause the formation of X-wax. When the X-wax is present in sufficient quantity to increase the dissipation losses in the paper-oil insulation, a thermal fault may occur, eventually leading to catastrophic thermal runaway and breakdown.
In other occurrences, however, instant final breakdown may occur without warning.
5.9 Graphical representations
Graphical representations of gas ratios are convenient to follow this evolution of faults visually. Annex B gives examples of graphical representation of faults.
These representations are also useful in cases which do not receive a diagnosis using table 2, because they fall outside the gas ratios limits. Using figures B.1 or B.2, the zone or box which is closest to such an undiagnosed case can be easily visualized and attributed with caution to this case. Figure B.3 is particularly useful since it always provide a diagnosis in such cases.